Inside the Loan Book | A BirrMetrics news analysis series| Issue 03
Lending to influential shareholders climbed 65 percent in a year of expanding credit. Behind the earnings figures, Wegagen’s accounts show where lending grew, how troubled loans changed and the rising cost of financing expansion.
Wegagen Bank’s lending to influential shareholders grew more than twice as fast as its overall loan book in the year ended June 2026, giving borrowers with an ownership connection to the bank a larger share of its outstanding credit.
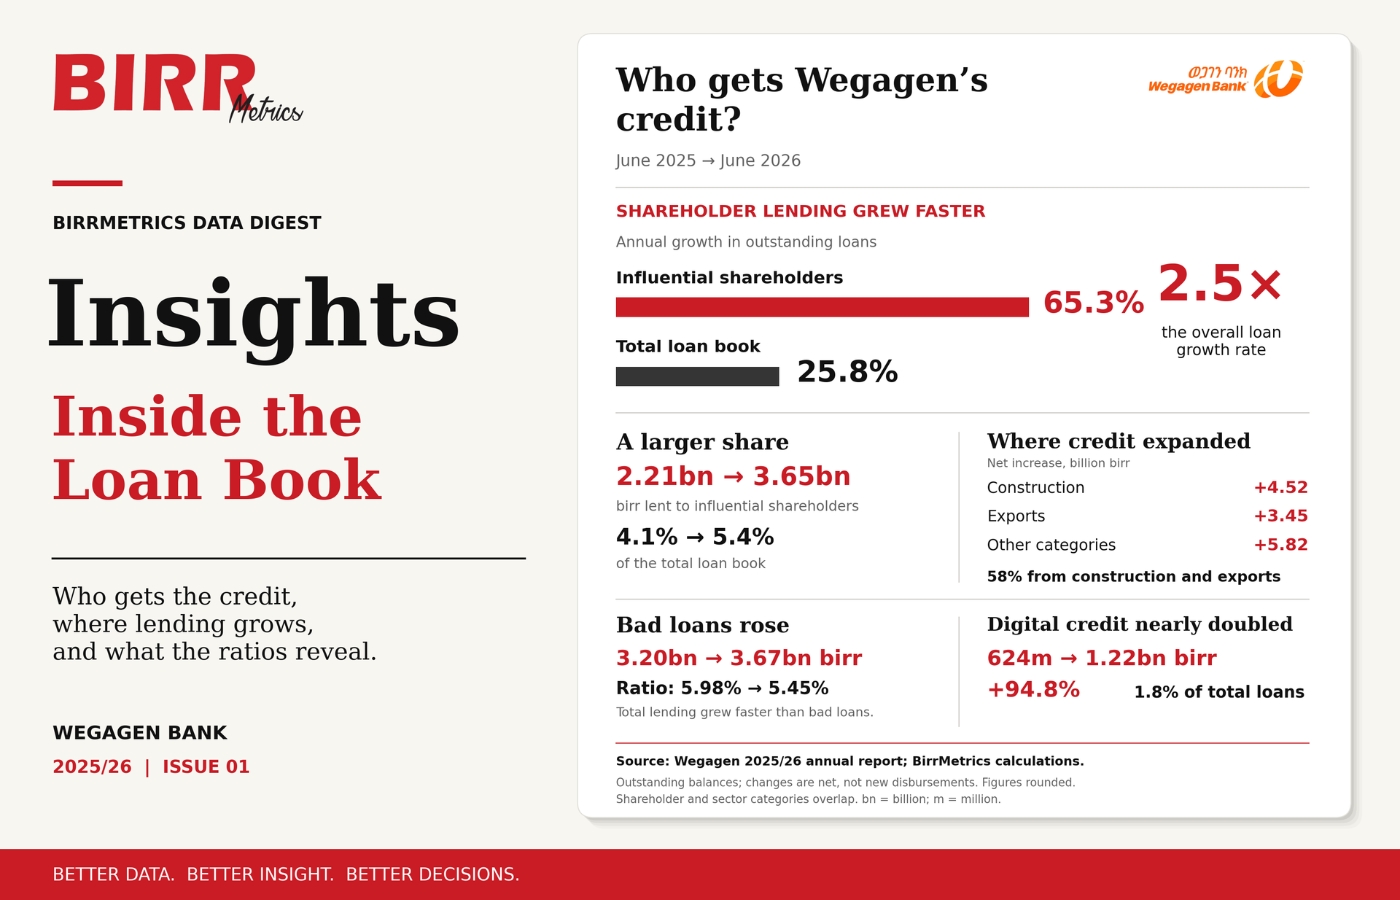
Loans to borrowers identified in the accounts as “influential shareholders” reached 3.65 billion birr, up from 2.21 billion birr a year earlier. The increase of 65.3 percent compares with growth of 25.8 percent in the bank’s gross loans and advances, according to BirrMetrics’ calculations from its annual report.
For every 100 birr of outstanding lending, these shareholders accounted for about 5.42 birr, compared with 4.13 birr a year earlier. Their loan balances increased by 1.44 billion birr, equivalent to roughly a tenth of the bank’s total loan-book expansion.
The change offers another way to examine a banking year usually presented through profit, revenue and deposits: follow the credit to see whose borrowing increased, which businesses attracted more financing and how much risk remained at the end of the year.
Wegagen’s gross loan book reached 67.32 billion birr, an increase of 13.79 billion birr. Its bank-only pretax profit rose about 10 percent to 4.26 billion birr. But the expansion was uneven. Shareholder lending grew considerably faster than the portfolio; construction and exports accounted for most of the increase in sector balances; and non-performing loans rose in value even as their share of lending declined.
The related-party disclosure separates influential shareholders from key management personnel. Loans to the latter increased from 98.11 million birr to 128.07 million birr. Together, the two categories owed 3.78 billion birr, up from 2.31 billion birr. They accounted for 5.6 percent of gross loans at the end of June.
Most lending remained outside these disclosed categories. Even after subtracting both shareholder and management loans, the remaining portfolio grew by approximately 24 percent. The finding is that disclosed related-party credit expanded substantially faster than an already growing book.
Wegagen describes its related-party transactions as occurring in the normal course of business. However, the related-party table does not identify the individual borrowers, show how the balances are distributed among them or set out their interest rates, collateral and repayment performance. It establishes the scale and growth of the exposure.
Related-party status describes a borrower’s relationship with the bank; the sector breakdown describes the activity being financed. The same loan can appear in both.
Viewed by industry, the strongest shift was towards construction. Outstanding construction loans reached 12.76 billion birr, up from 8.24 billion birr. That increase of 4.52 billion birr accounted for almost one-third of the entire loan book’s expansion.
Construction’s share of lending consequently rose from approximately 15.4 percent to 19 percent. Its balance grew by nearly 55 percent, considerably faster than manufacturing, where lending increased by 14.6 percent to 9.00 billion birr.
Export lending provided another substantial source of growth. It rose from 8.79 billion birr to 12.24 billion birr. Taken together, construction and exports accounted for almost 58 percent of the net increase in outstanding loans. These are changes in balances after repayments and other movements, rather than measures of all loans disbursed during the year.
Import financing remained the largest category at 14.97 billion birr, or just over 22 percent of the portfolio. Wegagen described its lending as diversified across major economic sectors. The balances support a more specific observation: although credit remained spread across several industries, the year’s expansion was led disproportionately by two of them.
This changes what readers should watch in subsequent accounts. As construction takes a larger share of lending, repayment performance in that sector matters more to the bank’s overall results. The sector balances themselves do not show whether the construction loans financed housing, commercial buildings, contractors or public projects, each of which could face different repayment conditions.
At the other end of the lending business, digital credit grew rapidly from a much smaller base. Outstanding digital loans nearly doubled to 1.22 billion birr, but still represented only 1.8 percent of total gross lending.
Within that balance, the largest digital category was working capital for micro, small and medium enterprises, at 802.54 million birr. Agricultural value-chain financing accounted for a further 348.95 million birr. The report describes Efoyta, offered in collaboration with Kifya’s Qena platform, as serving businesses’ working-capital needs and salaried employees requiring emergency financing.
Here, the distinction between money lent over time and money still owed is particularly important. The digital-lending table reports cumulative disbursements of 9.06 billion birr through June 2026, against the outstanding balance of 1.22 billion birr. Repaid short-term loans can generate substantial activity without leaving an equally large balance at year-end. Comparing cumulative digital disbursements directly with outstanding shareholder or construction loans would exaggerate digital lending’s place in the portfolio.
Growth also changed the appearance of credit quality. Wegagen’s non-performing loans increased from 3.20 billion birr to 3.67 billion birr, an additional 472.73 million birr. Yet their share of gross lending fell from approximately 5.98 percent to 5.45 percent.
Both movements are consistent. Non-performing loans grew by about 14.8 percent, while the overall loan book expanded by 25.8 percent. The troubled balance became a smaller proportion of a larger total, despite increasing in birr terms.
The lower ratio cannot, on its own, establish that recoveries improved or that fewer loans became troubled. It shows that the non-performing balance grew more slowly than total lending.
Another 2.58 billion birr was classified as Stage 2, or special mention, compared with 2.42 billion birr a year earlier. This category is distinct from non-performing loans and should not be described as money already in default. It nevertheless adds another part of the portfolio to monitor as the newer lending matures.
Against the Stage 3 non-performing balance, Wegagen reported a loss allowance of 1.8 billion birr, equivalent to approximately 49 percent, almost unchanged from the previous year. An allowance below the full loan balance does not by itself establish inadequate provisioning: expected losses depend in part on recoveries, collateral and when repayment is expected. The useful comparison is whether the allowance keeps pace with changes in the troubled portfolio and the assumptions behind recovery estimates.
Nothing in the related-party table links the shareholder balances to these non-performing loans. Treating the two disclosures as evidence about the same borrowers would go beyond what the report establishes.
Financing the larger loan book also became more expensive. Customer deposits increased by 19.2 percent to 73.52 billion birr, slower than gross lending. These deposits are shown separately from money deposited by financial institutions, so they do not represent the bank’s entire funding base.
The bank-only accounts show total interest expense rising by approximately 48 percent to 4.67 billion birr. Interest paid on fixed-term deposits increased particularly sharply, from 1.44 billion birr to 2.53 billion birr. Those are annual expenses, rather than the interest rates paid to individual depositors; the increase can reflect both the amount of funding and its price and duration.
Interest income also rose strongly, by about 38 percent to 11.69 billion birr. After interest costs, the bank retained net interest income of 7.02 billion birr, up approximately 32 percent. Lending and investment income continued to outpace funding expenses in absolute birr terms, even though expenses grew faster in percentage terms.
At the reporting date, Wegagen also had 5.5 billion birr in outstanding interbank borrowing. Of that amount, 3.5 billion birr was overnight funding at 12 percent, while two seven-day facilities carried rates of 12 percent and 13 percent.
There had been no corresponding outstanding interbank balance at the previous year-end. That does not mean the bank had never borrowed during the previous year, nor does a single reporting-date balance demonstrate financial distress. It does show that short-term borrowing formed part of the funding position at June 2026. The annual accounts cannot establish whether that position was typical or temporary.
For related coverage on Ethiopian private banking performance, explore Wegagen Bank Assets Surge 2026: Balance Sheet Hits 111.3B Birr, and also keep track of capital market listings directly on the Ethiopian Securities Exchange (ESX) portal.